Case Study
McLaren Formula 1 Car Aerodynamics Simulation with Cadence Fidelity CFD Software
Formula 1 car design process

Overview

Enter to win
(opens in a new tab)Download and read the case study. Test your knowledge. Enter to win prizes.
Take the quizIntroduction
Developing a Formula 1 car is a complex and fast-paced process. The McLaren F1 car consists of thousands of components with complex interactions, using technologies such as computer-aided design (CAD), computer-aided manufacturing (CAM), and computer-aided engineering (CAE), which are essential for producing competitive designs.
Aerodynamic performance plays a crucial role in the design of the McLaren F1 car. The car aerodynamic optimization is centered around increasing downforce and reducing drag. Because of highly complex non-linear aerodynamic interaction effects, such an objective requires going beyond an isolated component optimization to consider the complete car airflow management with all the complexity of the generated vortices and wakes.
In general, car performance is defined not only by its design but also by the conditions. For example, car aerodynamics would be heavily influenced by the wake from another car ahead, which can cause the loss of up to 50% of downforce. In addition, car design must consider and optimize for both corners and straights. To tackle such complex engineering challenges of car optimization, both CAE technologies and computational fluid dynamics (CFD), in particular, are being efficiently applied.
CFD computations can become increasingly expensive as the need for accuracy is pushed to its limits. In this context, access to more computational resources could provide a key advantage to the team, which is why the Fédération Internationale de l'Automobile (FIA) has capped the available resources. Other strategies, therefore, need to be employed to maximize the number of meaningful simulations that can be performed within this constrained environment, which can provide a competitive edge. An engineer can work in three key areas to reduce the cost of an individual simulation: meshing (reducing the cell count), simulation (reducing the computational time on a given mesh), and setup time. First, using anisotropic meshing allows for reducing the cell count without compromising accuracy in regions where gradients are mostly in a single direction. Then, using an efficient solver with fast convergence, such as the coupled pressure-based solver (PBS) in Fidelity CFD, reduces the computational time per simulation. Finally, leveraging full workflow automation with Python allows engineers to focus on analyzing the results rather than spend time setting up the projects.
In 2022, the FIA introduced a significant update to the Sporting, Technical and Financial Regulations, aimed at producing closer racing. Within car design, a priority focus was reducing turbulence and wake, reducing downforce loss when following, and enabling cars to run closer together. Such a significant regulation change leads to the search for new ways to accelerate the development cycle and reduce the turnaround time of aerodynamic analysis.
![McLaren Formula 1 2021 and 2022 design comparison [1]](/content/dam/cadence-www/global/en_US/images/resources/success-stories/mclaren-formula-fig-2.jpeg "McLaren Formula 1 2021 and 2022 design comparison [1]")
McLaren Formula 1 2021 and 2022 design comparison [1]
The case study presented in this article shows how engineers and designers can assess more designs faster, optimize the car, and push performance closer to the limit by leveraging key technologies in the CFD workflow from the Cadence Fidelity suite.
Case Study: McLaren F1 Car Simulation
Formula 1 car geometry
The considered car geometry, called the F1 Uniform model, has been supplied by Formula 1 to McLaren Racing. This model includes all the main external aerodynamics features that have a significant impact on aerodynamic performance. The wheel internal blocks are not included in the simulation considered but can also be handled in the framework of aerothermal analysis. The external domain size ensures a blockage ratio below 0.5%.

F1 Uniform Geometry - 1/2 Model
In the considered case, the wheel and the ground surfaces are joined by a plinth to ensure a mesh with good quality and capturing at the connection. A specific treatment is applied for such wheel-ground connection in the solver.
The Multiple Reference Frames approach is not required in this case since the wheels’ internal geometry is not considered in this simplified analysis. The wheel geometries are, therefore, axisymmetric and can be handled with a simple boundary condition treatment.
Modeling approach
When conducting a conjugate heat transfer (CHT) analysis with wheel internals, multiple blocks need to be defined since they involve both solid and fluid regions as well as rotating and static regions.
This analysis only studies the external aerodynamics and does not consider the internal wheel geometries. A single-block approach is therefore possible. The computational domain is still divided into several blocks representing various parts of the geometry. The multi-block approach offers multiple advantages. The first is better flexibility, enabling the choice of a tailored meshing approach for each block. The use of the anisotropic surface-to-volume meshing is of particular interest for the front and rear wing regions where the use of stretched mesh along leading and trailing edges can result in a 10X reduction in the cell count, and therefore, the same reduction of the computational effort related to the given block at the simulation stage.
The second benefit of multi-block mesh generation is a lowered mesh generation time by meshing the various blocks in parallel on separate computational nodes.
The third crucial advantage of the multi-block approach is the possibility of swapping only blocks of interest in the design or optimization process. This approach brings several benefits:
- Reduced computational resources spent at the mesh generation stage since only needed blocks are remeshed.
- Faster turnaround time if a block that is not computationally limiting is remeshed. In practice, remeshing the separated front wing or rear wing blocks leads to a turnaround time reduction.
- Better consistency of results. Meshing only certain blocks ensures no mesh changes in the other regions.
The current case study is based on a three-block approach where the front wing and the rest of the car are separated into different domains. The third and last block is the heat exchanger in the sidepod, where a porous media model will be implemented to model its physics. In this cold flow simulation, there is no thermal modeling and only the pressure drop through the heat exchangers is taken into account.
Geometry cleaning and preparation in Fidelity CFD
The Formula 1 Uniform geometry considered in this case study is cleaned and prepared in CAD software. However, it is common in the design process to have geometry faults and start with a geometry not fully prepared in CAD software. The Fidelity CFD geometry management functionalities are highly efficient in preparing such geometries. The following is an example of geometry faults in the imperial front wing (IFW) case:

Non-conformal locations (free edges) in the IFW geometry. Credit for the given and the following images: Filipe Fabian Buscariolo, Imperial College London. Obtained under Creative Commons: Attribution 4.0 License. URL: https://data.hpc.imperial.ac.uk/resolve/?doi=6049
There are multiple ways to fix the non-conformal locations, the main ones being geometry sewing/knitting on the CAD level or repairing/stitching triangles on the tessellation levels. Both methods can easily fix the highlighted issue.
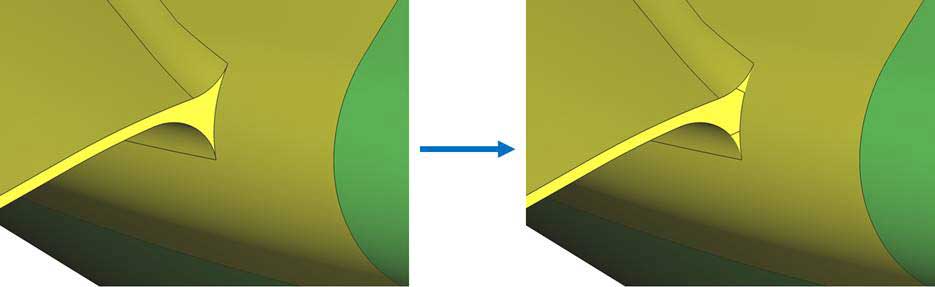
After fixing the geometry connectivity, the grouping algorithm is usually applied to reduce the number of edges, keeping only the hard edges with significant dihedral angles between parts. The grouping tool in Fidelity CFD also offers the possibility to retain fillets and leading edges that can be important at the meshing stage for prescribing specific settings such as junction or anisotropic leading-edge refinements.

IFW geometry before (left) and after (right) grouping
As the last step after grouping, it is suggested to defeature corners with sharp angles where acceptable. Such selective defeaturing on user-prescribed parts of the geometry leads to an improvement in the mesh quality, especially in terms of skewness and orthogonality, and thus results in faster and more robust simulation.
IFW geometry before (left) and after (right) defeaturing sharp angles
These geometry repair operations are automated through python scripting and performed in parallel such that the whole geometry can be cleaned in a matter of seconds to minutes.
Meshing strategy
Front wing meshing
The front wing is meshed in Fidelity Hexpress using the Cadence best-practice-based surface-to-volume approach [2] in which the initial tessellation is first remeshed with the surface mesher followed by the boundary layer extrusion and the tetra- or hexa-core mesh generation. The best-practice-based approach for refinement is based on the AIAA workshop [3] and Cadence meshing guidelines [4]. The mesh thus ensures sufficient and consistent surface mesh and boundary layer resolution appropriate for the correct trend prediction and design comparison.

Wing surface mesh and the highlighted anisotropic refinement regions
The front wing mesh has only 11.4M cells, while an equivalent mesh with isotropic refinement contains more than 50M cells. Such small cell count at the given resolution is attained thanks to the advanced mesh anisotropy feature whereby elongated cells are placed in the areas where flow gradients in one direction are significantly larger than in another direction. Examples of this are wing rounded leading and blunt trailing edges where the velocity and pressure gradients in the chordwise direction are significantly larger than in the spanwise direction.
The approach enables the resolution of even the smallest elements, such as fences, blunt edges, and junctions with acceptable cell counts.
a)

b)
c)

d)
Anisotropic surface mesh of the front wing in the region of a) the body nose, b) the wingtip, c) and d) the wing fence
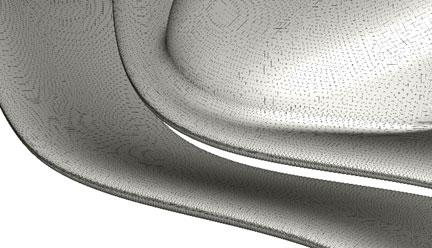
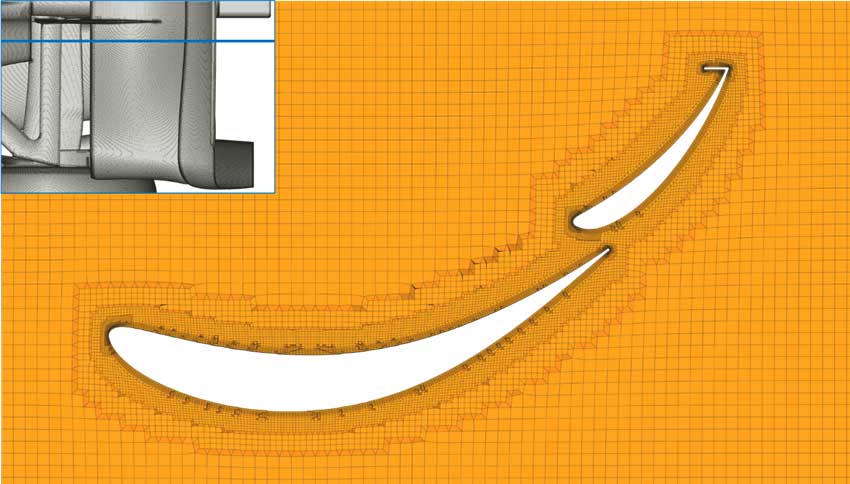
The boundary layer mesh is generated using the extrusion technique that enables high total thickness not limited to the isotropy requirement and ensures a 100% layer coverage on every surface. The collisions between the boundary layer fronts from different lifting elements are automatically managed by adding a mixed-element reconnection layer in between.
Volume mesh cut in the middle of the wing span
The generated mesh is optimal for the design comparison in the exploration or the optimization process. A high-fidelity mesh targeting resolutions close to grid-independence (for instance, resolving quantities of interest such as downforce or drag within 0.1% or one count) can be generated by increasing the resolution in several regions:
-
 The number of trailing edge cells can be increased to 10 and more to better capture the wake behind it,
 - The boundary layer expansion ratio can be reduced below 1.2, and several constant thickness cells can be added next to the wall following the AIAA guidelines [2],
- The volume region can be refined for a more accurate vortex and wake prediction.
Full car multi-block meshing
The main block, containing front, mid, and rear parts apart from the front wing, is meshed using the volume-to-surface unstructured meshing approach in Fidelity Hexpress. This is often a preferable approach for complex unclean geometries that include multiple free edges, non-manifold edges, piercing surfaces, or holes. The volume-to-surface approach supports such configuration and can be used efficiently together with Fidelity AutoSeal to close holes. On the other hand, anisotropic meshing is not strictly required for blocks that do not have major lifting surfaces.
The Hexpress mesher automatically refines the mesh based on the local geometry curvature, edge proximity, surface proximity, and surface junctions, appropriately refining important zones such as leading, trailing edges, and gaps. Such an approach minimizes the need for manual user inputs and leads to a high-quality mesh that is also sufficiently robust to be used within a design exploration or optimization study. Additional optimization is applied to meet solver-specific target quality metrics. In this case, PBS-specific quality optimization is applied.
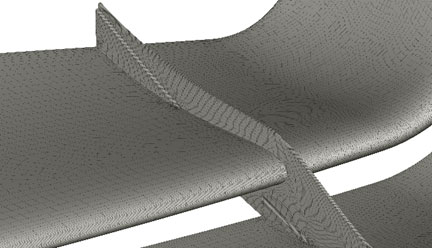
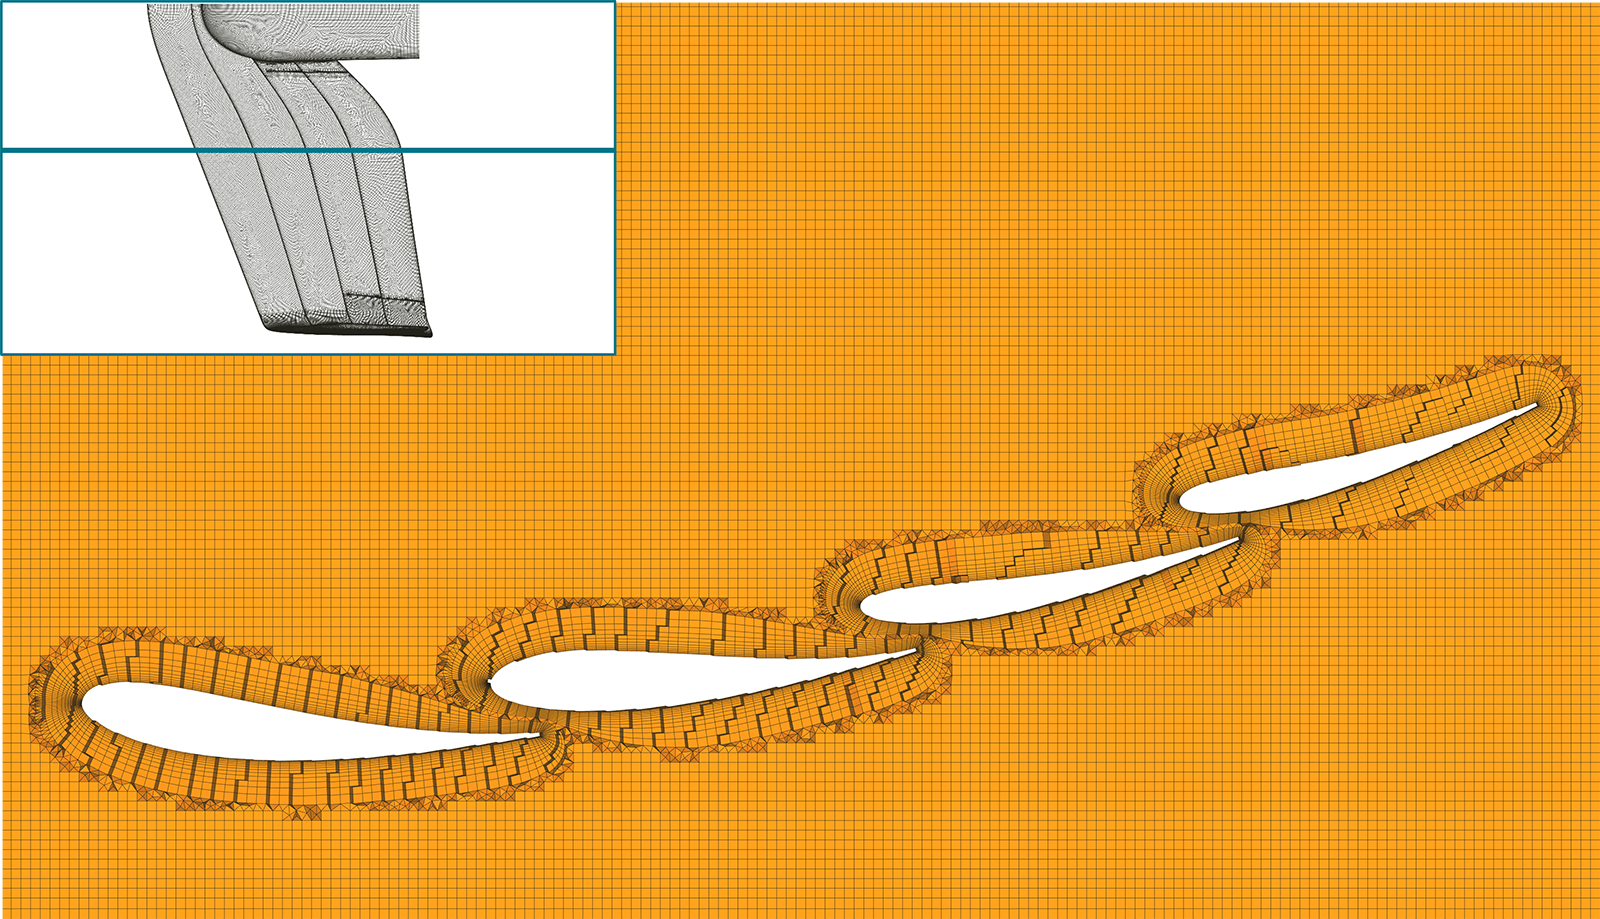
The whole process is fully automated from geometry import to postprocessing, with all blocks being meshed in parallel on separate computational nodes to reduce the global turnaround time to a minimum. The image below shows the resulting mesh of the full multi-block. The transition between the main block and the front wing block grids is displayed, as they use different meshing strategies. Similarly, the following are more dedicated images for different parts of the Formula 1 Uniform:
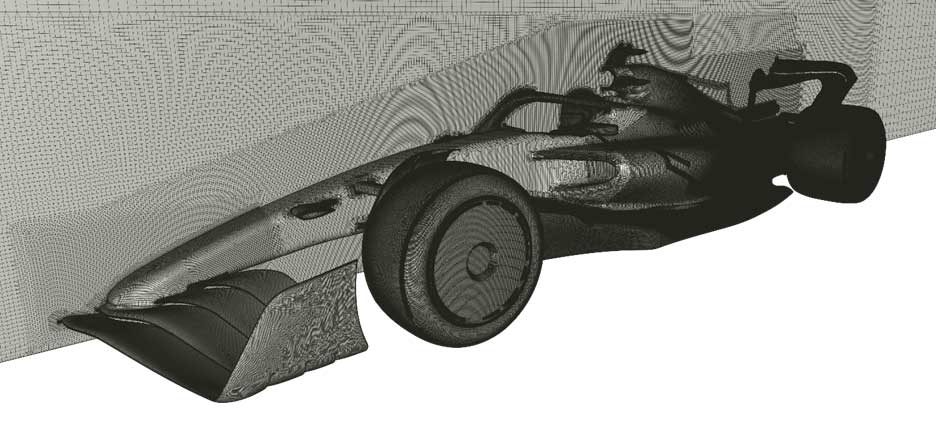
Surface mesh of the full car and the symmetry plane

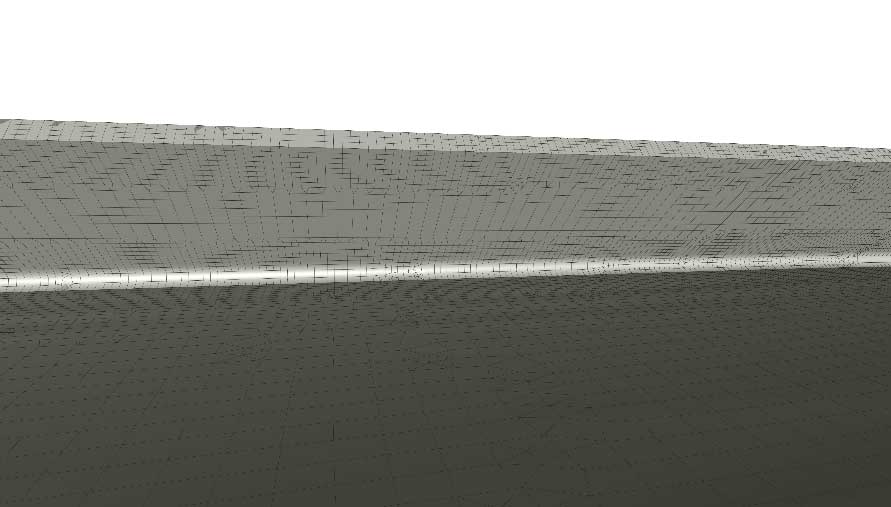
Surface mesh in the region of the side mirror
Volume mesh cut through the rear wing
The final mesh of the full car has 145 million cells and is composed of the elements shown in the table below. The mixed-element meshing approach is used instead of the full hexahedral one to ensure better geometry capturing. This is especially relevant for narrow gaps or surfaces with sharp dihedral angles.
| Number of cells (millions) | |
|---|---|
| Total number of cells | 143,4 |
| Hexahedrons | 98,7 |
| Prisms | 29,1 |
| Pyramids | 9,2 |
| Tetrahedrons | 6,4 |
| Surface quads | 8,7 |
| Surface triangles | 6,3 |
The main quality metrics used for Fidelity PBS are skewness and non-orthogonality, as also used in the OpenFOAM solver. Meshes with maxima skewness and non-orthogonality below 4 and 70°, respectively, are considered of good quality. The PBS solver is nevertheless robust to bad-quality cells exceeding the above-mentioned thresholds. The limit quality values for ensuring low impact on the simulation stability are defined as 8 for skewness and 88° for non-orthogonality.
| Quality metric | Value | Max. recommended values | Nb of cells over recommended values | Max. acceptable values (Fidelity PBS) |
|---|---|---|---|---|
| Max. non-orthogonality | 81.18° | 70° | 14,731 | 88° |
| Max. skewness | 3.40 | 4 | 0 | 8 |
Good mesh quality and capturing were attained by using several dedicated automatic refinement techniques in various locations. The auto edge proximity refines the mesh between surface edges, helping to mesh small or thin surfaces such as the trailing edges. The surface proximity refinement functionality with the orientation and connectivity check is used in the main block for improving the meshing in narrow gaps. This feature allows refining between surfaces that are not connected by an edge or a vertex. Additionally, this refinement checks the orientation of the surfaces to avoid increasing the cell count significantly. Another surface proximity option is used in the internal parts of the sidepod. This feature enables the user to automatically refine not only gaps but also connected surfaces with sharp dihedral angles between them at an optimum refinement level. The following images show examples of the above-mentioned locations:
Auto edge proximity refinement used to refine the Gurney flap of the rear wing

Surface mesh of the end of the bodywork and the exhaust pipe. Gap has been meshed using the surface proximity refinement functionality, due to the small clearence

Volume mesh cut of the gap between the sidepod bodywork and the inner body. The surface proximity functionality has been used to better capture the narrow gap and complex surface connection in the inner body shown
Porous media block mesh
The porous media block is placed in the inner part of the sidepod to model the heat exchanger. As seen in figure, it is not aligned with the main axes, being rotated by an angle of 65° with respect to the longitudinal axis. The volume-to-surface mesher has a dedicated capability for the octree mesh reference frame adjustment to adapt to the mesh orientation in the block. This functionality helps create an aligned orthogonal mesh in such a block, ensuring excellent mesh and solution quality. The following image displays grids with and without the rotation of frame:

Heat exchanger position in the internal part of the sidepods


Heat exchanger surface meshes: on the left, the mesh has not been aligned with the main axes, whilst on the right it has been aligned
Simulation setup
The simulation setup is based on the Fidelity Flow coupled all-Mach pressure-based solver with the algebraic multigrid convergence acceleration algorithm [5]. This solver is particularly efficient for low-speed (Mach number below 0.3) regime such as the one observed in automotive aerospace and for the conjugate heat transfer (CHT) computations. Multiple physical models are available in the framework of such simulations, such as volumetric heat source, porous medium, radiation heat transfer, and others. The fluid compressibility is modeled in this case, while the incompressible fluid definition is also available. In general, the difference between compressible and incompressible solutions in pressure and aerodynamic forces coefficients exceeds 1% locally where the Mach number exceeds 0.15, making the compressible model necessary for high-fidelity simulations. On the other hand, the use of incompressible flow enables the decoupling of the energy from the equation system, which reduces the total computational time.
Different Reynolds Averaged Navier-Stokes turbulence models are available in the PBS solver [5], from the classical 2 equation models as k-ω Menter SST, to RSM (Reynolds Stress Model) and EARSM (Explicit Algebraic RSM). In the present Formula 1 simulations, the k-ω Menter SST equations are used together with the extended wall function.
The figure below shows the external domain used in the simulations, presenting its sizes in reference to the car’s length. Furthermore, this figure also shows the different boundary conditions applied to the domain. No-slip walls are imposed on the body, whilst the wheels are modeled with non-slip rotation velocity.

Domain used for the simulations with sizes and boundary conditions. L refers to the car length, equal to 5.5m
Finally, the heat exchanger block is modeled as a porous media using the Darcy-Forchheimer model [6]. The model is considered non-homogeneous, allowing it to take into account the expected directionality.
Result analysis
All the main quantities of global quantities of interest such as lift, drag, moment, and mass flow rates through internal mesh patches (thin walls) are outputted directly from the solver. The flow visualization and computation of additional custom quantities can be performed in Fidelity Results Analysis or in external postprocessing tools.

a)

b)
Pressure (a) and friction (b) coefficient surface contours

Velocity magnitude field around the car

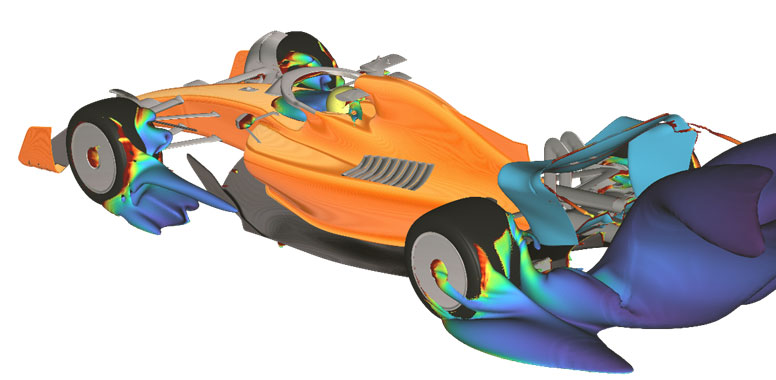
Iso-surface corresponding to the 0 total pressure coefficient value (C_Pt=0), highlighting the vortex core and separated flow regions
The car aerodynamics is largely influenced by the vortical and wake flow features. The Fidelity Results Analysis offers two methods for detecting the vortex core: the Sawada method and the Parallel vector [7, 8]. The figure below shows the result obtained with the Parallel vector method.

Detection of vortex cores around the car using the Parallel vector method
Streamlines are useful for studying the global three-dimensional behavior of the flow around the car. The following image shows the streamlines around the F1 Uniform car:
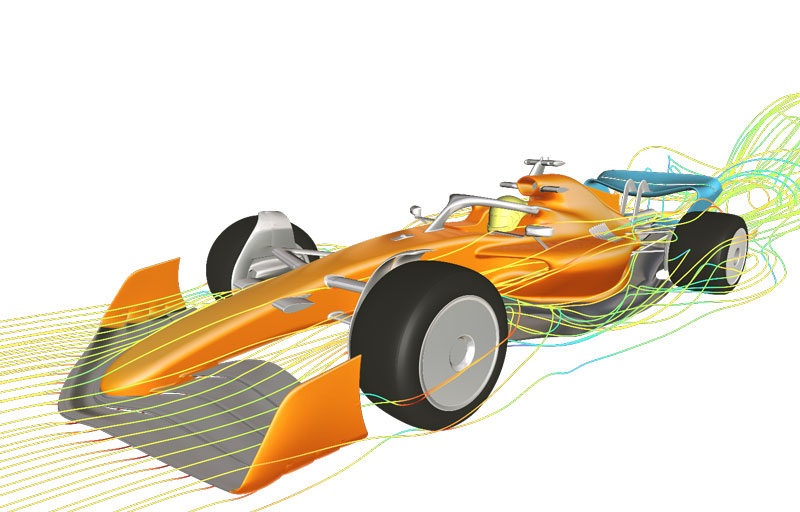
Streamlines around the car colored by the velocity magnitude
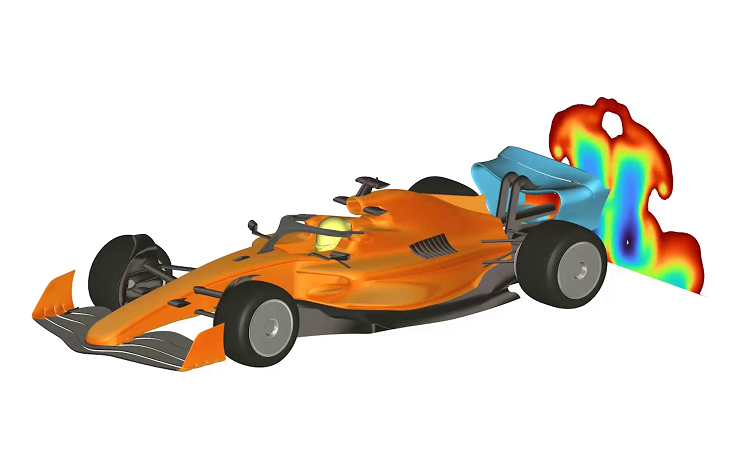
Finally, additional postprocessing approaches are available in Fidelity CFD for a deeper understanding of the flow around the car and studying how vortices are created and directed to other parts of the car. Such visualization can be generated by sweeping a cutting plane colorized by a quantity of interest along the car’s longitudinal axis. It can be easily done by leveraging Fidelity’s advanced automation capabilities using Python API. The following is an example of such an animation. The total pressure coefficient is plotted on the plane to show the energy in the flow relative to the car.
6. Conclusions
Car aerodynamic development is an extraordinarily complex and fast-paced process. It can thus largely benefit from the use of efficient CAE and CFD technologies. Using recent advances such as the anisotropic mesher, coupled pressure-based solver technologies, and advanced automation with Python at the core of the Fidelity CFD environment offers a competitive edge that can be decisive in the race outcome. The turnaround times attained with Cadence Fidelity CFD technologies can help the McLaren F1 designer team assess many more designs, better optimize the car, and push performance closer to the limit.
References
- Formula 1 [@F1]. “Comparing this year with last”. 2022, Feb 11. Tweet – X.
- Mallol B., Boogaard M., Delsate N., and Hirsch C. “New meshing methods for ship propellers and hydrofoils”, Proceedings, 24th Numerical Towing Tank Symposium, October 2022, Zagreb, Croatia
- Vassberg J., DPW-VII Opening Remarks, Aviation 2022, June 25, 2022.
- Mesh Generation Guidelines. Version: 11.3. 4th High Lift Prediction Workshop (HLPW-4).
- Mangani L., Casartelli E., Darwish M. “Coupled pressure based CFD solver for turbomachinery flows: overview of applications”, Europ Proceedings of 13th European Conference on Turbomachinery Fluid dynamics & Thermodynamics ETC13, Lausanne, Switzerland, April 8-12, 2018
- Ward, J. C., “Turbulent Flow in Porous Media”, Journal Hydraulics Division Proceedings of ASCE, Vol. 5, pp. 1-12 (1964)
- Roth, M., Peikert, R., “A higher-order method for finding vortex core lines. In IEEE Visualization ’98, pages 143–150, October 1998.
- Sawada, K., “A convenient visualization method for identifying vortex center,” Transaction of the Japan Society for Aeronautical and Space Sciences, Vol. 38, No. 120, pp. 102-116, 1995.